The UK Driving Test Pass Rate Hit 50.1% in 2026: What the Latest DVSA Data Really Shows
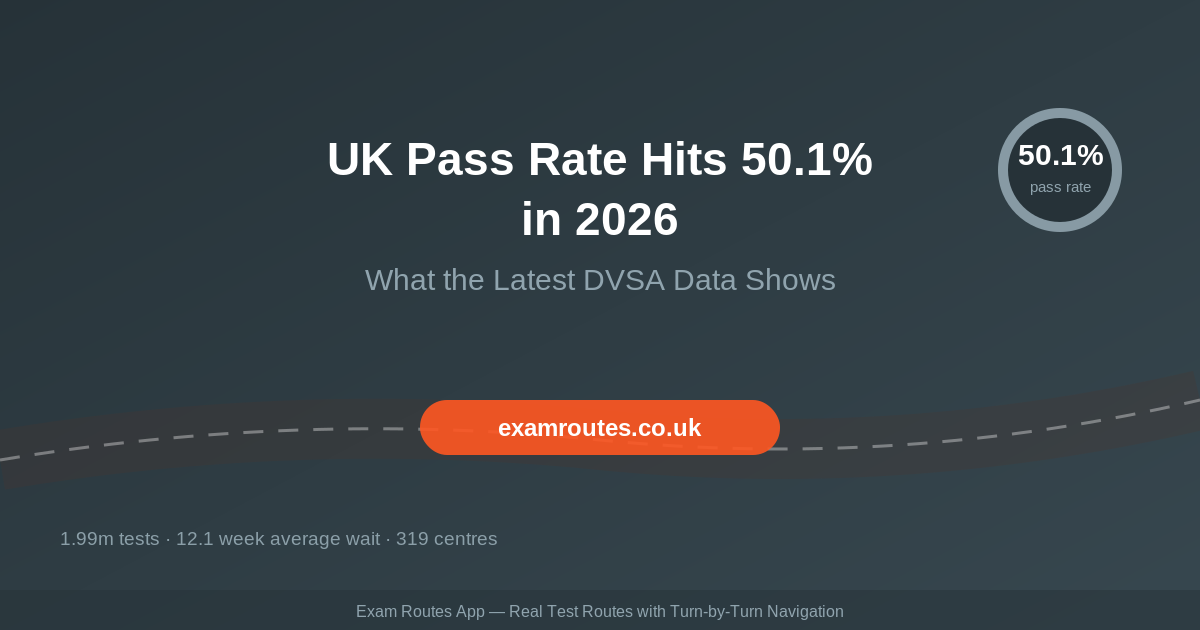
The DVSA’s published figures for the financial year April 2025 to March 2026 put the national car practical pass rate at 50.1%, across 1,990,665 tests conducted at 319 test centres in England, Scotland and Wales. The average wait between booking a test and taking it stood at 12.1 weeks as of June 2026.
Three numbers, three separate stories. Here is what each of them actually tells learners planning a test in 2026.
1. Half of All Tests Now Pass — But That Is Not New
Crossing the 50% line makes a good headline, but the national pass rate has hovered in a narrow band for years. It moves by fractions of a percentage point, not by leaps. The figure is weighted by test volume, so the big urban centres pull it down and the small rural ones pull it up, and the balance between them barely changes year to year.
The practical implication for a learner is simple: your personal odds have very little to do with the national number. They are set by your preparation, and secondarily by which centre you book.
2. Waiting Times Have Fallen — From a Very High Base
An average wait of 12.1 weeks is a meaningful improvement on the peaks of recent years, when many learners were routinely quoted the full 24-week booking horizon. But an average conceals an enormous spread.
At the June 2026 release, the longest waits in Great Britain were:
- Forfar — 29.7 weeks
- Arbroath — 27 weeks
- Bedford — 25.1 weeks
- Leighton Buzzard (Stanbridge Road) — 24 weeks
- Pinner (London) — 23.1 weeks
And the shortest:
- Greenham — 2.9 weeks
- Salisbury — 3.6 weeks
- Barrow In Furness — 3.7 weeks
- Boston — 3.7 weeks
- Bodmin — 3.9 weeks
That is a ten-fold difference between the best and worst centres. Because there is no catchment area for the practical test in Great Britain, a learner who is willing to travel can cut months off their wait — at the cost of being tested on roads they do not know.
Practise Real Test Routes on Your Phone
The Exam Routes App gives you access to real driving test routes with turn-by-turn navigation. Practise at your own pace and build confidence before test day.
3. The Gap Between Centres Is Enormous
Across the 275 centres with enough test volume for a meaningful rate, the spread runs from the mid-30s to around 70%:
Highest pass rates: Montrose 70%, Melton Mowbray 69.7%, Barrow In Furness 69.6%, Dorchester 69%, Pwllheli 68.1%.
Lowest pass rates: Wolverhampton 34.3%, Wednesbury 35%, Featherstone 36.4%, Dunfermline (Vine) 36.4%, Gateshead 37.5%.
A learner at Montrose is roughly twice as likely to pass as a learner at Wolverhampton. That difference is not about examiner leniency. It is about roads. Rural and small-town centres run test routes with fewer multi-lane junctions, less bus and lorry traffic, fewer complex one-way systems and lower pedestrian density. Urban centres run the opposite.
What This Means If You Are Booking a Test in 2026
Do not chase a pass rate blindly. Booking a rural centre you have never driven near, with a long wait, is often a worse bet than a local urban centre whose roads you know. The pass rate reflects the road environment; if you have not practised that environment, the advantage evaporates.
Do check waiting times before you commit. A centre 40 minutes away with a four-week wait against a local one with a 20-week wait is a genuine decision worth making. DVSA publishes this data and it changes monthly.
Do weigh the small-centre caveat. Centres conducting fewer than 500 tests a year have volatile pass rates. A handful of results moves the percentage by several points, which is why DVSA figures for very small centres should be read as an indication of the roads rather than a reliable prediction.
Do practise the actual routes. Whichever centre you choose, the single highest-return preparation is driving the roads the examiner will use. That is true at 34% centres and 70% centres alike.
Where These Numbers Come From
All figures are from the DVSA statistical data sets DRT122A (pass rates by test centre and month) and DRT122F (test availability and waiting times), published on GOV.UK under the Open Government Licence. Pass rates run to March 2026; waiting times to June 2026. Northern Ireland is not included — driving tests there are run by the DVA, which does not publish comparable centre-level statistics.
Frequently Asked Questions
What is the UK driving test pass rate in 2026?
The national car practical pass rate for the DVSA year April 2025 to March 2026 was 50.1%, from 1,990,665 tests across 319 centres in England, Scotland and Wales.
Which test centre has the highest pass rate?
Among centres with enough volume for a meaningful figure, Montrose led at 70%, followed by Melton Mowbray at 69.7% and Barrow In Furness at 69.6%.
Which test centre has the lowest pass rate?
Wolverhampton at 34.3%, followed by Wednesbury at 35% and Featherstone at 36.4%.
How long is the wait for a driving test now?
The average was 12.1 weeks in June 2026, but individual centres ranged from under three weeks to nearly 30 weeks.
Should I book a test at a centre with a higher pass rate?
Only if you can practise its routes. The higher pass rates come from quieter roads, and that advantage only helps if you have driven them.
Improve Your Own Odds — Practise the Real Routes
Stop guessing which roads the examiner will use. The Exam Routes App maps the routes learners actually get tested on, with turn-by-turn navigation you can follow on a normal practice drive.