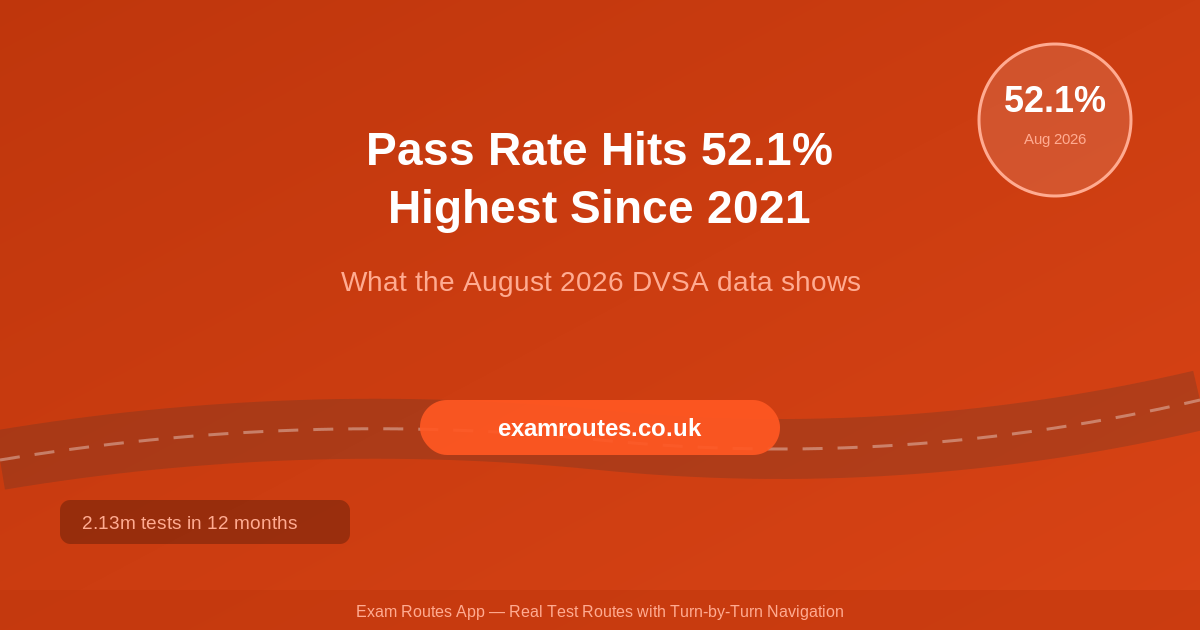
In August 2026, 52.1% of candidates passed their practical driving test — the highest monthly figure recorded since April 2021, and the ninth consecutive month above 50%. After a decade in which the pass rate rarely troubled the halfway mark, that is a genuine shift.
Here is what the numbers show, what is plausibly driving the change, and what it does and does not mean for learners booking a test this autumn.
The Headline Figures
| Measure | Latest figure | Context |
|---|---|---|
| Practical pass rate, August 2026 | 52.1% | Highest monthly rate since April 2021 |
| Consecutive months above 50% | Nine | Historically the rate sat in the mid-to-high 40s |
| Tests conducted, 12 months to August 2026 | Over 2.13 million | Highest rolling 12-month total on record |
| Tests April-August 2026 | Over 906,000 | Up around 15.5% year on year |
| Learners tested within seven weeks, August 2026 | 40% | Six in ten still wait longer than the DVSA target |
| Examiner numbers | Highest since November 2017 | Result of sustained recruitment |
Why the Pass Rate Is Rising
There is no single official explanation, but several factors point in the same direction.
Longer waits mean better-prepared candidates. This is the most widely cited theory. When a test date is six months away, learners accumulate more hours before they sit it. The waiting-time crisis has been miserable for learners, but it has almost certainly pushed average preparation up.
The cost of failing has risen. With retests hard to come by and lesson prices up, both learners and instructors have become more cautious about booking before someone is genuinely ready. Fewer speculative attempts means a higher pass rate, even if underlying driving standards are unchanged.
More examiners, steadier testing. Examiner numbers are at their highest since 2017. A better-staffed system runs fewer rushed or rescheduled sessions, which is better for candidates.
Booking behaviour has changed. Anti-bot measures and reforms to the booking service have made it harder to hold speculative slots, which reduces the number of candidates who turn up to a date they never really intended to keep.
What it is not: there has been no announced change to the marking standard. Examiners are assessed for consistency, and the DVSA has not relaxed what counts as a serious or dangerous fault. A rising pass rate reflects who is taking the test, not a softer test.
Practise Real Test Routes on Your Phone
The Exam Routes App gives you access to real driving test routes with turn-by-turn navigation. Practise at your own pace and build confidence before test day.
The Waiting-Time Picture Is Still Difficult
The volume numbers are the strongest part of the story. More than 2.13 million tests in twelve months is a record, and over 906,000 between April and August alone represents a 15.5% year-on-year increase.
But capacity is only half of the equation. In August 2026, just 40% of learners across Great Britain waited less than seven weeks between booking and taking their test. The DVSA’s own target is seven weeks. Six in ten learners are still outside it.
The agency has also committed to publishing waiting-time data at national, regional and test-centre level — a response to a National Audit Office recommendation. That transparency matters: it lets learners see whether their own centre is improving or stuck, rather than relying on a single national average.
What This Means for You
- Do not read 52% as “the test got easier”. Roughly half of all candidates still fail. The marking standard has not moved.
- Preparation is what changed. If the rise is driven by better-prepared candidates, the way to be on the right side of it is to be one of them.
- Book when you are ready, not when a date appears. The pass-rate rise is partly the product of exactly this discipline.
- Check your own centre’s figures. National averages hide spreads of twenty points between centres. Local data is more useful.
- Expect to wait. Capacity is improving, but a majority of learners still wait longer than seven weeks. Plan around that rather than hoping.
How Exam Routes App Can Help
If the rising pass rate really is a preparation story, then how you use a long wait is the whole game. The Exam Routes App maps real test routes around UK test centres with turn-by-turn navigation, so the months between booking and testing can be spent driving the roads your examiner is likely to use rather than circling familiar streets.
A long wait is frustrating. It is also, handled well, the reason more people are passing.
Frequently Asked Questions
What is the current UK driving test pass rate?
The practical car test pass rate reached 52.1% in August 2026, the highest monthly figure since April 2021, and has stayed above 50% for nine consecutive months.
Has the driving test been made easier?
No change to the marking standard has been announced. Examiners are quality-assured for consistency, and the rise is more plausibly explained by better-prepared candidates and changed booking behaviour.
How many tests is the DVSA carrying out?
More than 2.13 million practical tests were conducted in the twelve months to August 2026, the highest rolling twelve-month total on record, with over 906,000 between April and August.
Are waiting times getting shorter?
Slowly. In August 2026, 40% of learners were tested within seven weeks of booking, meaning six in ten waited longer than the DVSA target.
Where can I see waiting times for my own test centre?
The DVSA has committed to publishing waiting-time data at national, regional and individual test centre level, following a National Audit Office recommendation on transparency.
Get the Edge on Test Day
Half of all candidates still fail. Practise real test routes with turn-by-turn navigation and make your waiting time count.